prometheus exporter
https://github.com/kumina/openvpn_exporter
docker run -p 9176:9176 \
  -v /path/to/openvpn_server.status:/etc/openvpn_exporter/server.status \
  kumina/openvpn-exporter -openvpn.status_paths /etc/openvpn_exporter/server.status
metrics output fragments
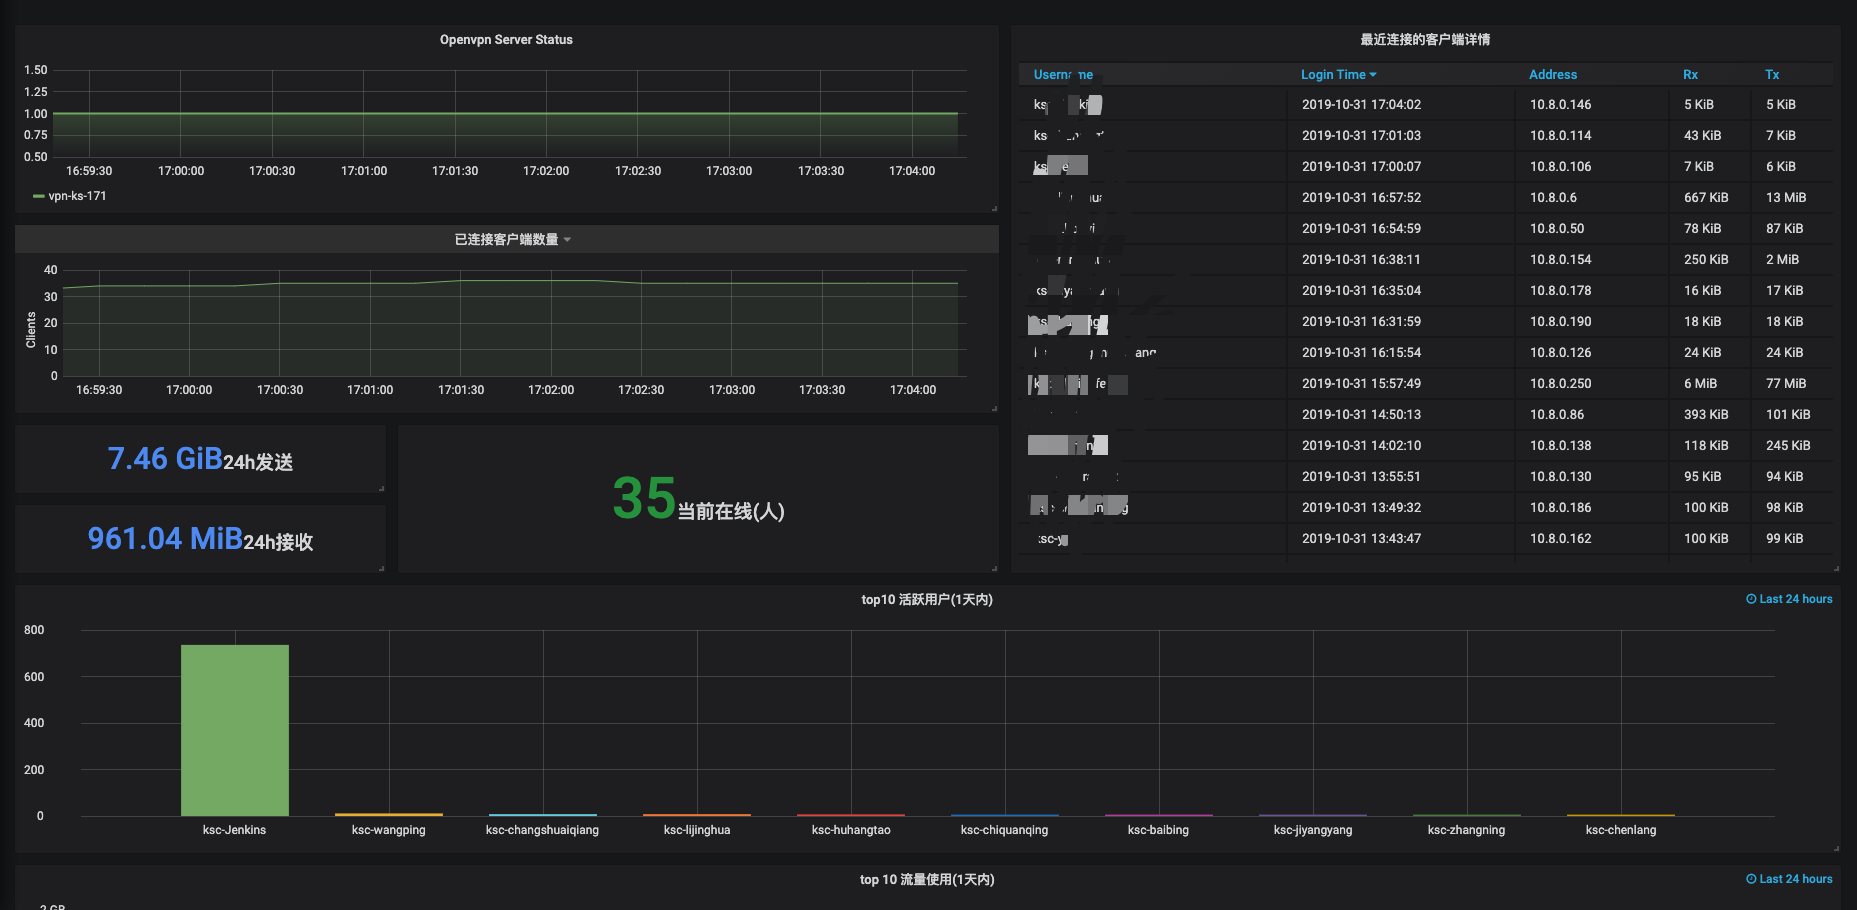
openvpn_nx_server_client_received_bytes_total{common_name="ksc-Jenkins",connection_time="1572516966",real_address="111.200.55.10:30068",status_path="/tmp/openvpn-status.log",username="UNDEF",virtual_address="10.8.0.146"} 5021
openvpn_nx_server_client_received_bytes_total{common_name="ksc-admin-tool-wiki",connection_time="1572038645",real_address="111.200.55.10:55214",status_path="/tmp/openvpn-status.log",username="UNDEF",virtual_address="10.8.0.122"} 3.624655498e+09
openvpn_nx_server_client_received_bytes_total{common_name="ksc-baibing",connection_time="1572515511",real_address="111.200.55.8:26570",status_path="/tmp/openvpn-status.log",username="UNDEF",virtual_address="10.8.0.190"} 14973
openvpn_nx_server_client_received_bytes_total{common_name="ksc-caifeng",connection_time="1572354411",real_address="124.42.103.139:61166",status_path="/tmp/openvpn-status.log",username="UNDEF",virtual_address="10.8.0.54"} 1.1308474e+07
openvpn_nx_server_client_received_bytes_total{common_name="ksc-changshuaiqiang",connection_time="1572509754",real_address="111.200.55.8:49974",status_path="/tmp/openvpn-status.log",username="UNDEF",virtual_address="10.8.0.126"} 277561
openvpn_nx_server_client_received_bytes_total{common_name="ksc-chenlang",connection_time="1572515049",real_address="111.200.55.9:51671",status_path="/tmp/openvpn-status.log",username="UNDEF",virtual_address="10.8.0.38"} 35848
openvpn_nx_server_client_received_bytes_total{common_name="ksc-chiquanqing",connection_time="1572515481",real_address="111.200.55.8:26418",status_path="/tmp/openvpn-status.log",username="UNDEF",virtual_address="10.8.0.186"} 17595
openvpn_nx_server_client_received_bytes_total{common_name="ksc-dingran-v2",connection_time="1572501351",real_address="111.200.55.8:46983",status_path="/tmp/openvpn-status.log",username="UNDEF",virtual_address="10.8.0.130"} 131906
set openvpn server config file
增加配置,修改默认日志级别,需要重启
status-version 2
prometheus server config file
prometheus.yml
·····
 - job_name: 'vpn-ks-171'
    metrics_path: /metrics
    static_configs:
    - targets: ['172.20.0.171:9176']
·····
service prometheus restart
grafana add dashboard and data source
https://grafana.com/grafana/dashboards/10562 dashboard ID
demo