环境
国外数据中心联邦节点 IP:8.9.0.1 (公网、专线等,要与Prometheus Server网络打通)
Metrics 网络环境:NAT网络(没有对外公共ip) 内网ip:172.21.31.56
主机分布: Prometheus Server节点 北京
Prometheus 联邦节点 海外新加坡
端口分布: Prometheus端口:9090
Nginx安全认证之后的端口:9091
业务需求
北京数据中心的Prometheus Server 需要抓取部署在国外的数据中心暴露出来的Exporter数据,但是该主机是NAT网络,无法直接对外提供服务,还有许多种方法可以跨数据中心从这台机器拿数据,比如加个负载均衡、加个Nginx代理之类的。
安全的考虑
安全组 + Nginx 认证 + 监控 默认的9090端口将会在安全组这里做限制,不要抱着没人知道我们在哪台机器开启了哪些敏感端口没人知道的心态,爬虫和端口嗅探太多了,我们要从根本上杜绝。
联邦制是什么
对于大部分监控规模而言,我们只需要在每一个数据中心安装一个Prometheus Server实例,就可以在各个数据中心处理上千规模的集群。同时将Prometheus Server部署到不同的数据中心可以避免网络配置的复杂性。
联邦集群的特性可以帮助用户根据不同的监控规模对Promthues部署架构进行调整。例如如下所示,可以在各个数据中心中部署多个Prometheus Server实例。每一个Prometheus Server实例只负责采集当前数据中心中的一部分任务(Job),例如可以将不同的监控任务分离到不同的Prometheus实例当中,再有中心Prometheus实例进行聚合。
Prometheus的联邦制的本质与Zabbix Proxy 本质是一样的。
联邦划分原则
- 区域联邦
- 功能联邦
- 传统部署环境与容器环境联邦
架构原理
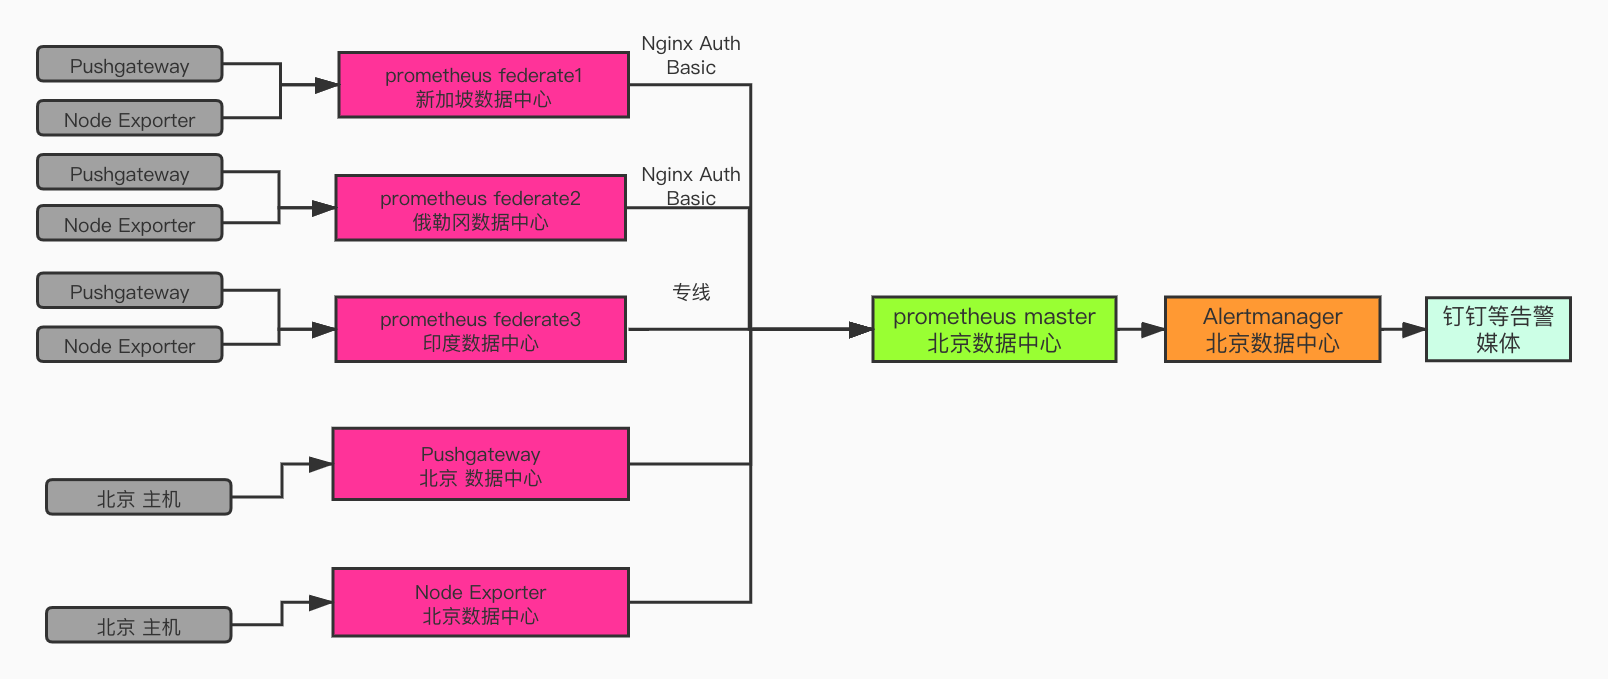
该如何配置
Prometheus 联邦节点
在国外的配置 8.9.0.1 配置
vim prometheus.yml 片段
global:
  scrape_interval:     15s # Set the scrape interval to every 15 seconds. Default is every 1 minute.
  evaluation_interval: 15s # Evaluate rules every 15 seconds. The default is every 1 minute.
scrape_configs:
  - job_name: 'prometheus'
    static_configs:
    - targets: ['localhost:9090']
  # 采集metrics数据地址,且命名
  - job_name: 'ssg-31-56-alarm'
    metrics_path: /actuator/alarm
    static_configs:
    - targets: ['172.21.31.56:8089']
Nginx添加认证
Nginx 基础认证详见 https://www.blog.lijinghua.club/article/nginx_authentication
代码配置块(Nginx 子配置文件)
server {
        listen 9091;
        server_name 8.9.0.1 ;
        add_header X-Frame-Options SAMEORIGIN;
	auth_basic   "Company Prometheus Metrics";
auth_basic_user_file /etc/nginx/pass_file;     #这里放的是认证文件位置

        location /{
                proxy_pass http://127.0.0.1:9090;
                proxy_redirect          off;
                proxy_set_header        X-Real-IP       $remote_addr;
                proxy_set_header        X-Forwarded-For $proxy_add_x_forwarded_for;
                proxy_set_header        Host            $host;
                proxy_next_upstream error timeout invalid_header http_500 http_502 http_503 http_504 http_404;
	access_log  /tmp/prometheus_access.log  ;
        }
        }
Prometheus Server
在北京数据中心的配置
vim prometheus.yml 片段
##  俄勒冈 监控数据
  - job_name: 'federate'
## Nginx 认证模块
    basic_auth:
      username: username
      password: password
    scrape_interval: 15s
    honor_labels: true
    metrics_path: '/federate'
    params:
      'match[]':
        - '{job="prometheus"}'
        - '{__name__=~"job:.*"}'
        - '{__name__=~"node.*"}'
        - '{__name__=~"or.*"}'
## 下面是详细的job名字,也可以写正则
        - '{job=~"ssg-31-56-alarm"}'
    static_configs:
      - targets:
## Nginx 代理的地址,后端地址是 8.9.0.1的 127.0.0.1:9090
        - '8.9.0.1:9091'
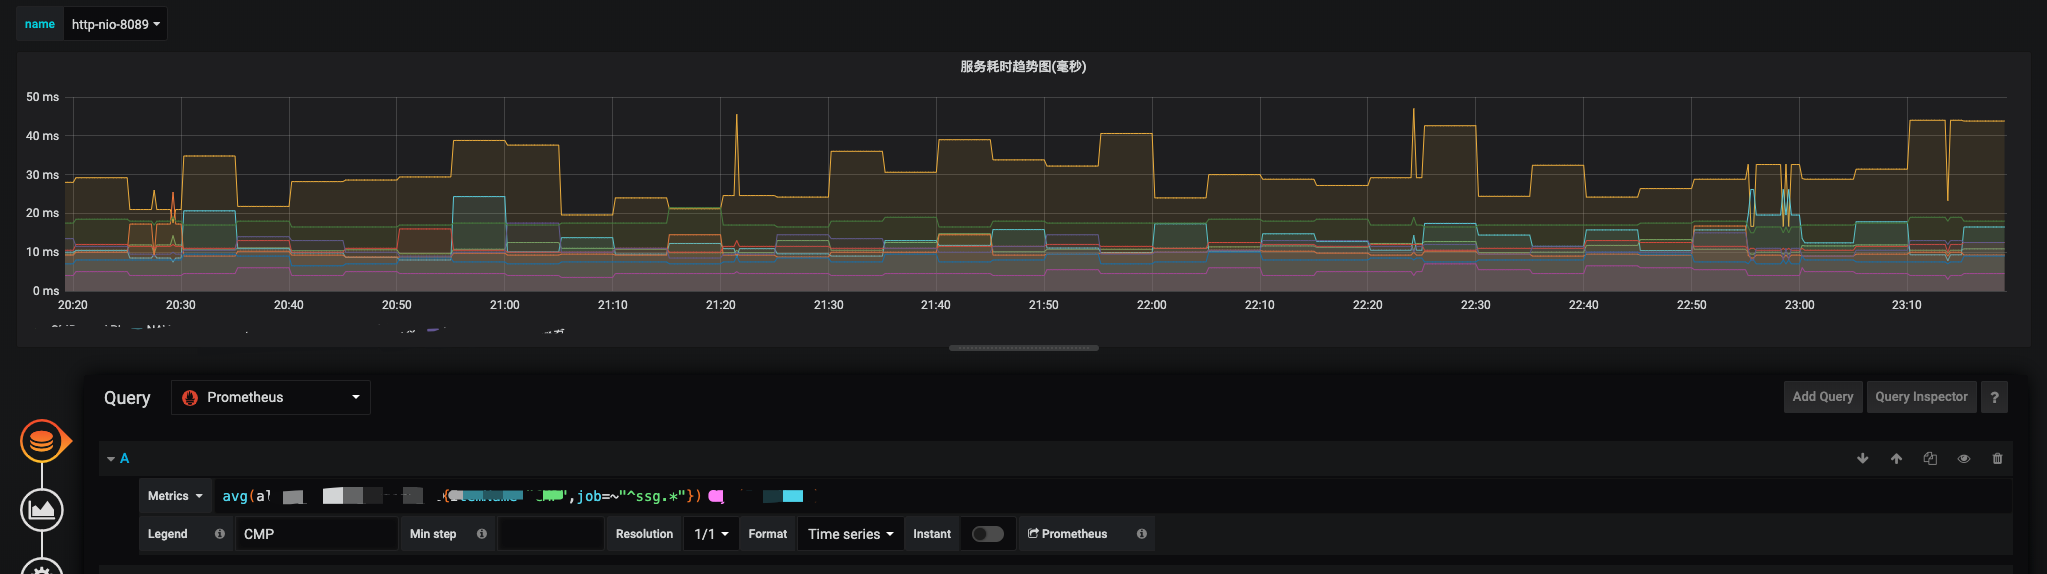
验证
跨数据中心,多环境同业务的监控场景下,最好使用job进行区分,比如新加坡的监控Metrics,命名为 ssg***
然后在PromeSQL里面加上 {,job=~"^ssg.*"}
旅途愉快~
大佬,请问__name__的匹配机制是如何的?